Market Outlook
April 02, 2018
Market Cues
Domestic Indices
Chg (%)
(Pts)
(Close)
Indian markets are likely to open flat tracking global indices and SGX Nifty.
BSE Sensex
(0.8)
(253)
32,923
U.S. stocks remain mostly positive in mid-day trading. The major averages have
Nifty
(1.0)
(101)
10,094
climbed firmly into positive territory after ending Wednesday's volatile session in the
Mid Cap
(1.6)
(256)
15,963
red. The Dow Jones closes up by 1.1% to close at 24,103. The NASDAQ ended up
Small Cap
(2.0)
(348)
17,228
by 1.6% to close at 7,063.
Bankex
(1.1)
(301)
27,309
U.K. stocks were modestly higher after the ONS's third estimate of growth showed
U.K. GDP grew by 0.4 percent in the final quarter of 2017, unchanged from the
Global Indices
Chg (%)
(Pts)
(Close)
second reading in February. The FTSE 100 was up by 0.2% to end at 7,057.
Dow Jones
1.1
255
24,103
On domestic front, Indian shares succumbed to selling pressure once again after
Nasdaq
1.6
114
7,063
financial and technology shares came under heavy selling pressure elsewhere in the
FTSE
0.2
12
7,057
U.S, Europe and Asia on privacy concerns and on worries about tighter industry
regulations. The BSE Sensex ended down by 0.8% at 32,923.
Nikkei
0.5
108
21,562
Hang Seng
0.2
71
30,093
News Analysis
Shanghai Com
0.4
13
3,182
Maruti ends 2017-18 with highest ever total sales at 1.77mn units
Detailed analysis on Pg2
Advances / Declines
BSE
NSE
Advances
903
588
Investor’s Ready Reckoner
Declines
1,767
1,235
Key Domestic & Global Indicators
Unchanged
176
47
Stock Watch: Latest investment recommendations on 150+ stocks
Refer Pg5 onwards
Volumes (` Cr)
Top Picks
BSE
6,092
CMP
Target
Upside
Company
Sector
Rating
(`)
(`)
(%)
NSE
43,398
Blue Star
Capital Goods Accumulate
754
867
15.0
Dewan Housing Finance
Financials
Buy
510
720
41.1
Net Inflows (` Cr)
Net
Mtd
Ytd
Century Plyboards
Forest Product
Buy
327
400
22.5
FII
1,094
13,372
13,865
Navkar Corporation
Others
Buy
151
265
75.7
*MFs
2,235
7,538
32,742
KEI Industries
Capital Goods Accumulate
385
436
13.2
More Top Picks on Pg4
Top Gainers
Price (`)
Chg (%)
Key Upcoming Events
Previous
Consensus
PYXISFIN
32
19.9
Date
Region
Event Description
Reading
Expectations
SUCROSA
30
19.8
Apr 03, 2018 Germany PMI Services
54.20
54.20
PGEL
315
18
Apr 03, 2018 Germany PMI Manufacturing
58.40
58.40
HINDMIL
372
14.7
Apr 05, 2018 UK
PMI Manufacturing
55.20
55.00
Apr 05, 2018 India
RBI Reverse Repo rate
5.75
RELICAB
40
14.3
Apr 05, 2018 India
RBI Repo rate
6.00
More Events on Pg7
Top Losers
Price (`)
Chg (%)
KWALITY
60
-19.9
DELTACORP
250
-16.1
VGCL
53
-15
SCTL
37
-13.9
FORTIS
123
-13.4
As on March 28, 2018
Market Outlook
April 02, 2018
News Analysis
Maruti ends 2017-18 with highest ever total sales at 1.77mn units
The country's largest car maker Maruti Suzuki India (MSI) reported a 14.9 per cent
increase in total sales at 160,598 units in March as against 139,763 units in the
year-ago month. The company's domestic sales stood at 148,582 units, up 16.1
per cent from 127,999 units in March last year. Exports in March this year were up
2.1 per cent to 12,016 units as compared to 11,764 units in the same month last
year. For the 2017-18 fiscal, the company sold 1,779,574 units, up 13.4 per cent
from 1,568,603 units in the 2016-17 financial year. Domestic sales during the
year rose by 14.5 per cent to 1,653,500 units from 1,444,541 units in 2016-17.
Economic and Political News
2016 Bihar topper scam: ED attaches key accuser’s assets worth Rs 45.3mn
UP tops rural housing chart; Yogi government disburses Rs 100-bn subsidy
Sebi exempts government from open offers for three PSBs post capital
infusion
Corporate News
Tesla recalls 123,000 Model S sedans over faulty steering component
IFC to invest in Nandan Nilekani-led growth fund Fundamentum Partnership
BSNL approaches DoT for recovery of Aircel's outstanding dues of Rs 420mn
Maruti ends 2017-18 with highest ever total sales at 1.77mn units
Market Outlook
April 02, 2018
Top Picks
Market Cap
CMP
Target
Upside
Company
Rationale
(` Cr)
(`)
(`)
(%)
Strong growth in domestic business due to its
leadership in acute therapeutic segment. Alkem
Alkem Laboratories
23,774
1,988
2,441
22.8
expects to launch more products in USA, which
bodes for its international business.
Favorable outlook for the AC industry to augur well
for Cooling products business which is out pacing
Blue Star
7,238
754
867
15.0
the market growth. EMPPAC division's profitability to
improve once operating environment turns around.
With a focus on the low and medium income (LMI)
consumer segment, the company has increased its
Dewan Housing Finance
16,001
510
720
41.1
presence in tier-II & III cities where the growth
opportunity is immense.
Well capitalized with CAR of 18.1% which gives
sufficient room to grow asset base. Faster resolution
ICICI Bank
1,78,943
278
416
49.4
of NPA would reduce provision cost, which would
help to report better ROE.
High order book execution in EPC segment, rising
KEI Industries
3,017
385
436
13.2
B2C sales and higher exports to boost the revenues
and profitability
Expected to benefit from the lower capex
Music Broadcast Limited
2,268
397
475
19.5
requirement and
15 year long radio broadcast
licensing.
Massive capacity expansion along with rail
Navkar Corporation
2,270
151
265
75.7
advantage at ICD as well CFS augur well for the
company
Strong brands and distribution network would boost
Siyaram Silk Mills
2,851
608
851
39.9
growth going ahead. Stock currently trades at an
inexpensive valuation.
Market leadership in Hindi news genre and no. 2
viewership ranking in English news genre, exit from
TV Today Network
2,915
489
603
23.4
the radio business, and anticipated growth in ad
spends by corporate to benefit the stock.
After GST, the company is expected to see higher
volumes along with improving product mix. The
Maruti
2,67,738
8,863
10,619
19.8
Gujarat plant will also enable higher operating
leverage which will be margin accretive.
We expect loan book to grow at 24.3% over next two
GIC Housing
2,005
372
655
75.9
year; change in borrowing mix will help in NIM
improvement
We expect CPIL to report net Revenue/PAT CAGR of
~17%/16% over FY2017-20E mainly due to healthy
Century Plyboards
7,256
327
400
22.5
growth in plywood & lamination business, forayed
into MDF & Particle boards on back of strong brand
& distribution network.
We expect sales/PAT to grow at 13.5%/20% over
LT Foods
2,719
85
128
50.6
next two years on the back of strong distribution
network & addition of new products in portfolio.
Third largest brand play in luggage segment
Increased product offerings and improving
Safari Industries
1,190
535
650
21.5
distribution network is leading to strong growth in
business. Likely to post robust growth for next 3-4
years
We expect HSIL to report PAT CAGR of ~15% over
FY2017-20E owing to better improvement in
HSIL Ltd
2,684
371
510
37.4
operating margin due price hike in container glass
segment, turnaround in consumer business.
We expect financialisation of savings and increasing
Aditya Birla Capital
32,144
146
230
36.5
penetration in Insurance & Mutual fund would
ensure steady growth.
Source: Company, Angel Research
Market Outlook
April 02, 2018
Fundamental Call
Market Cap
CMP
Target
Upside
Company
Rationale
(` Cr)
(`)
(`)
(%)
CCL is likely to maintain the strong growth trajectory
CCL Products
3,705
279
360
29.3
over FY18-20 backed by capacity expansion and new
geographical foray
We forecast Nilkamal to report top-line CAGR of ~9%
to `2,635cr over FY17-20E on the back of healthy
Nilkamal
2,268
1,520
2,178
43.3
demand growth in plastic division. On the bottom-line
front, we estimate ~10% CAGR to `162cr owing to
improvement in volumes.
The prism has diversified exposure in the different
segment such as Cement, Tile & ready mix concrete.
Prism Cement
5,459
108
160
47.5
Thus we believe, PCL is in the right place to capture
ongoing government spending on affordable housing
and infrastructure projects.
Elantas Beck India is the Indian market leader in liquid
insulation segment used in electrical equipments like
Elantas Beck India Ltd
1,619
2,042
2,500
22.4
motors, transformers etc. It derives demand from
several industries which are expected to register 10%+
CAGR in demand in the coming years.
Greenply Industries Ltd (GIL) manufactures plywood &
allied products and medium density fibreboards
(MDF). GIL to report net revenue CAGR of ~14% to
Greenply Industries
3,740
305
395
29.5
~`2,478cr over FY2017-20E mainly due to healthy
growth in plywood & lamination business on the back
of strong brand and distribution network
Source: Company, Angel Research
Market Outlook
April 02, 2018
Key Upcoming Events
Global economic events release calendar
Bloomberg Data
Date
Time Country
Event Description
Unit
Period
Last Reported
Estimated
Apr 03, 2018
1:25 PMGermany
PMI Services
Value
Mar F
54.20
54.20
1:25 PMGermany
PMI Manufacturing
Value
Mar F
58.40
58.40
Apr 05, 2018
2:00 PMUK
PMI Manufacturing
Value
Mar
55.20
55.00
2:30 PMIndia
RBI Reverse Repo rate
%
Apr 5
5.75
2:30 PMIndia
RBI Repo rate
%
Apr 5
6.00
2:30 PMIndia
RBI Cash Reserve ratio
%
Apr 5
4.00
Apr 06, 2018
6:00 PMUS
Change in Nonfarm payrolls
Thousands
Mar
313.00
189.00
6:00 PMUS
Unnemployment rate
%
Mar
4.10
4.00
Apr 10, 2018
US
Producer Price Index (mom)
% Change
Mar
(0.30)
Apr 11, 2018
6:00 PMUS
Consumer price index (mom)
% Change
Mar
0.20
2:00 PMUK
Industrial Production (YoY)
% Change
Feb
1.60
7:00 AMChina
Consumer Price Index (YoY)
% Change
Mar
2.90
Apr 12, 2018
India
Exports YoY%
% Change
Mar
4.48
India
Imports YoY%
% Change
Mar
10.41
5:30 PMIndia
Industrial Production YoY
% Change
Feb
7.50
Apr 13, 2018
China
Exports YoY%
% Change
Mar
44.50
Apr 16, 2018
12:00 PMIndia
Monthly Wholesale Prices YoY%
% Change
Mar
2.48
Apr 17, 2018
2:00 PMUK
Jobless claims change
% Change
Mar
9.20
6:45 PMUS
Industrial Production
%
Mar
0.95
6:00 PMUS
Housing Starts
Thousands
Mar
1,236.00
6:00 PMUS
Building permits
Thousands
Mar
1,321.00
7:30 AMChina
Industrial Production (YoY)
% Change
Mar
6.20
0-Jan-00UK
CPI (YoY)
% Change
Mar
2.70
Apr 18, 2018
0-Jan-00Euro Zone Euro-Zone CPI (YoY)
%
Mar F
1.10
Source: Bloomberg, Angel Research
Market Outlook
April 02, 2018
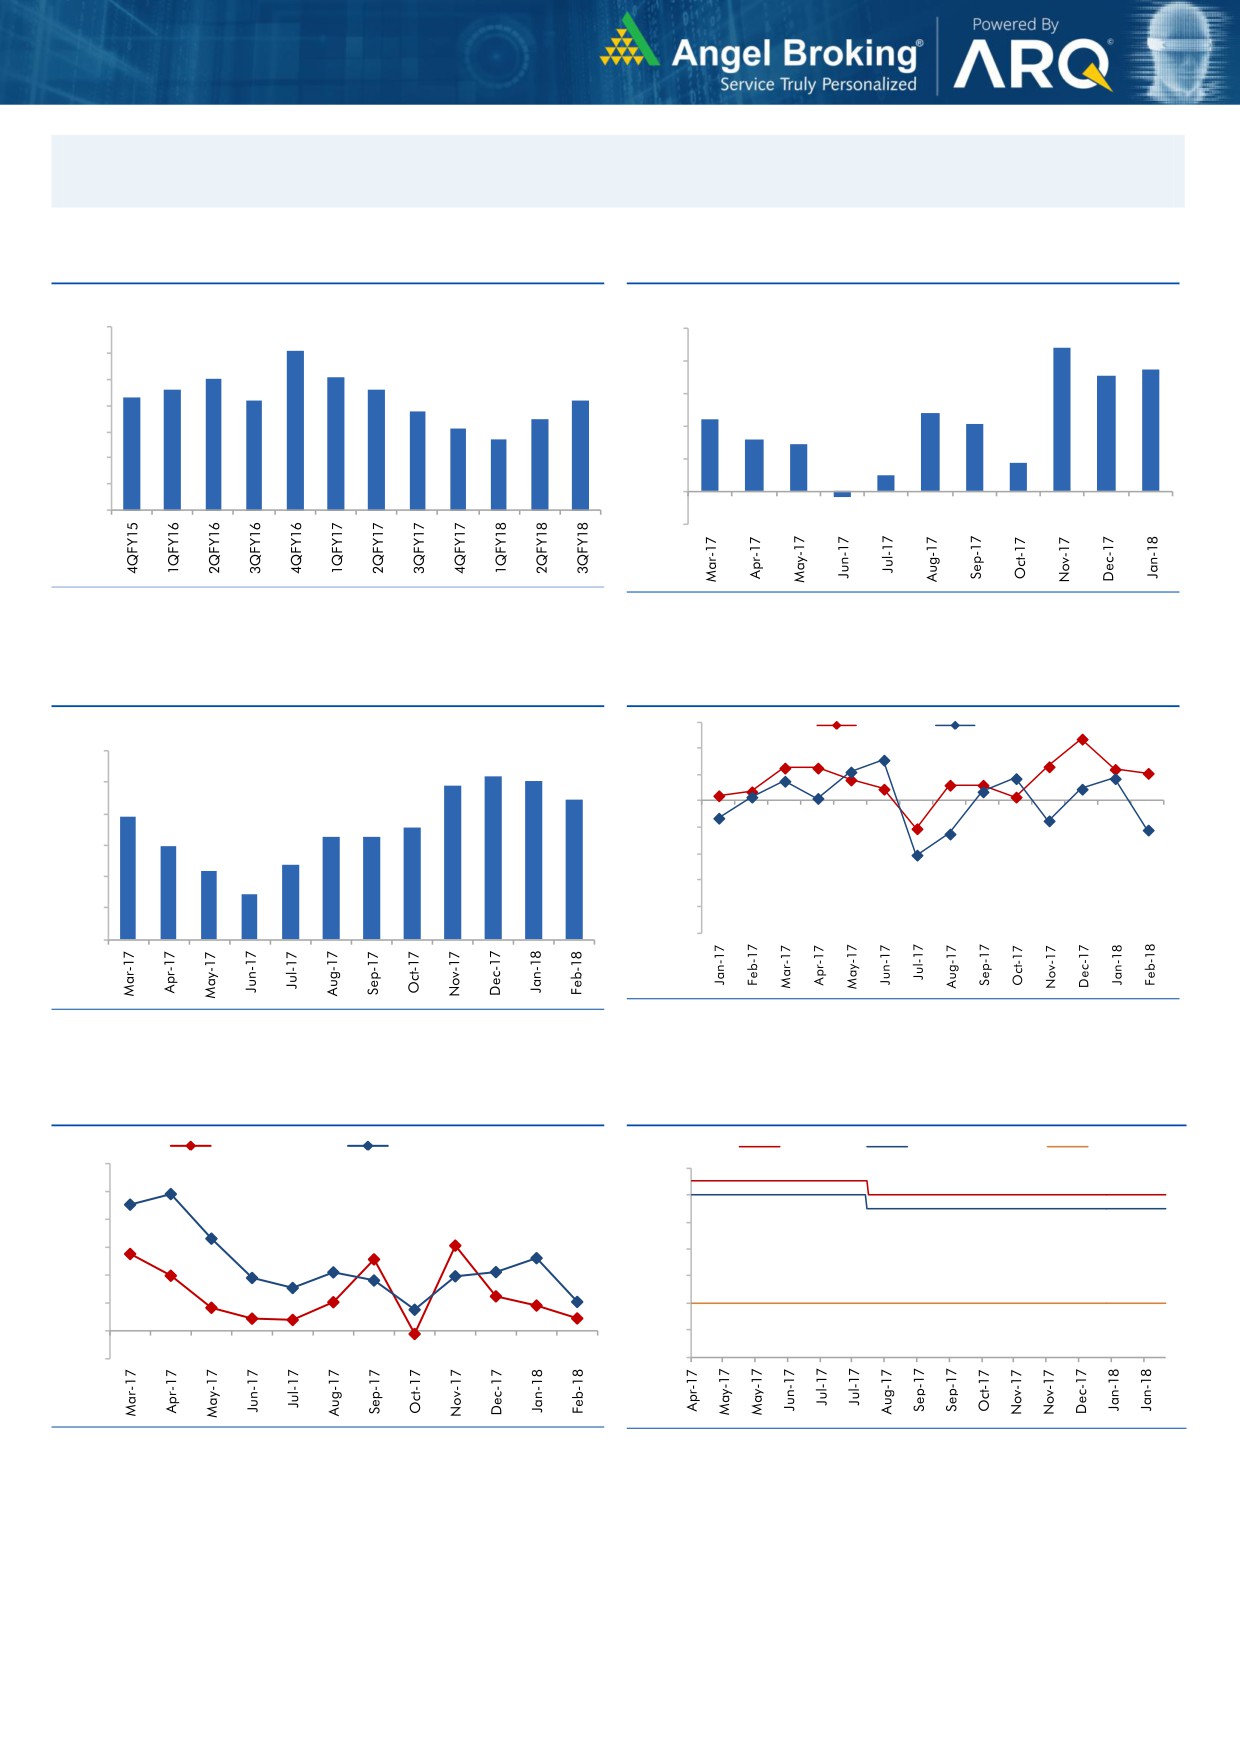
Macro watch
Exhibit 1: Quarterly GDP trends
Exhibit 2: IIP trends
(%)
(%)
10.0
10.0
9.1
8.8
9.0
7.5
8.0
8.1
8.0
7.1
7.6
7.6
8.0
7.3
7.2
7.2
6.8
6.0
4.8
7.0
6.5
4.4
6.1
4.1
5.7
4.0
3.2
2.9
6.0
1.8
5.0
2.0
1.0
4.0
-
3.0
(0.3)
(2.0)
Source: CSO, Angel Research
Source: MOSPI, Angel Research
Exhibit 3: Monthly CPI inflation trends
Exhibit 4: Manufacturing and services PMI
56.0
Mfg. PMI
Services PMI
(%)
6.0
54.0
5.2
5.1
4.9
52.0
5.0
4.4
3.9
50.0
4.0
3.6
3.3
3.3
3.0
48.0
3.0
2.4
2.2
46.0
2.0
1.5
44.0
1.0
42.0
40.0
-
Source: Market, Angel Research; Note: Level above 50 indicates expansion
Source: MOSPI, Angel Research
Exhibit 5: Exports and imports growth trends
Exhibit 6: Key policy rates
(%)
Exports yoy growth
Imports yoy growth
(%)
Repo rate
Reverse Repo rate
CRR
60.0
6.50
50.0
6.00
40.0
5.50
30.0
5.00
20.0
4.50
10.0
4.00
0.0
3.50
(10.0)
3.00
Source: Bloomberg, Angel Research
Source: RBI, Angel Research
Market Outlook
April 02, 2018
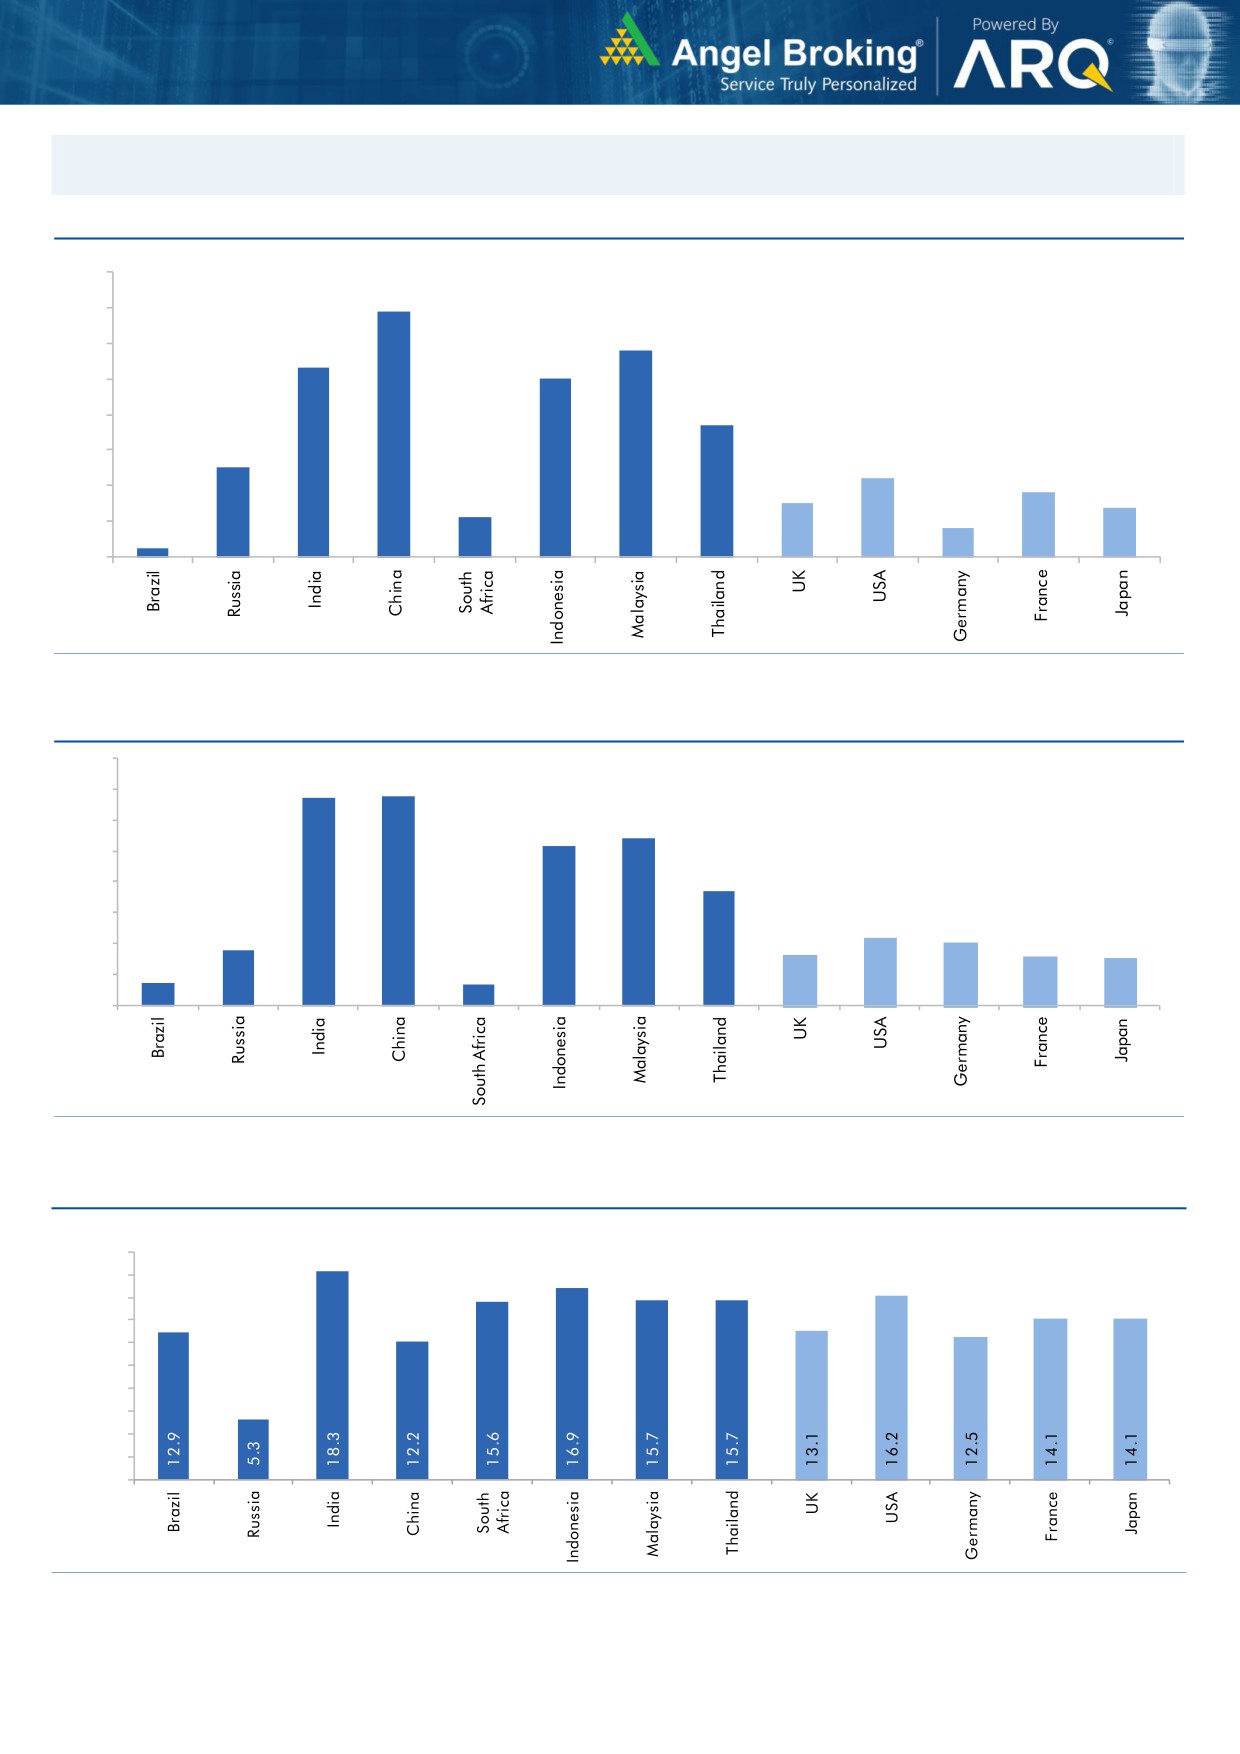
Global watch
Exhibit 1: Latest quarterly GDP Growth (%, yoy) across select developing and developed countries
(%)
8.0
6.9
7.0
5.8
6.0
5.3
5.0
5.0
1.1
3.7
4.0
2.5
3.0
2.2
1.8
2.0
1.5
1.4
0.8
1.0
0.3
-
Source: Bloomberg, Angel Research
Exhibit 2: 2017 GDP Growth projection by IMF (%, yoy) across select developing and developed countries
(%)
6.7
6.8
7.0
6.0
5.4
5.2
5.0
3.7
4.0
3.0
1.8
2.2
2.0
1.7
1.6
2.0
0.7
1.5
0.7
1.0
-
Source: IMF, Angel Research
Exhibit 3: One year forward P-E ratio across select developing and developed countries
(x)
20.0
18.0
16.0
14.0
12.0
10.0
8.0
6.0
4.0
2.0
-
Source: IMF, Angel Research
Market Outlook
April 02, 2018
Exhibit 4: Relative performance of indices across globe
Returns (%)
Country
Name of index
Closing price
1M
3M
1YR
Brazil
Bovespa
85,366
(1.8)
13.6
34.4
Russia
Micex
2,286
1.4
7.1
11.4
India
Nifty
10,114
(3.6)
(3.6)
11.0
China
Shanghai Composite
3,161
(2.8)
(3.0)
(2.0)
South Africa
Top 40
48,795
(5.9)
(6.1)
7.9
Mexico
Mexbol
46,125
(5.2)
(4.7)
(6.5)
Indonesia
LQ45
1,006
(8.4)
(5.9)
11.9
Malaysia
KLCI
1,856
(0.8)
5.5
5.8
Thailand
SET 50
1,164
(2.8)
3.1
18.1
USA
Dow Jones
24,103
(5.1)
(2.6)
16.3
UK
FTSE
7,057
(3.1)
(7.4)
(3.6)
Japan
Nikkei
21,159
(4.5)
(7.5)
11.1
Germany
DAX
12,097
(3.2)
(6.8)
(1.3)
France
CAC
5,167
(3.3)
(3.2)
1.3
Source: Bloomberg, Angel Research p68in4